OSU analytics team creates system to track COVID cases, keep everyone notified
Monday, September 20, 2021
Media Contact: Jordan Bishop | Communications Specialist | 405-744-9782 | jordan.bishop@okstate.edu
Larry Burns deals with numbers all day, every day. Where most people see a bunch of data, he sees a story.
But with all the COVID-19 data he and the team at Oklahoma State University’s Department of Institutional Research and Analytics (IRA) have dealt with, even they were starting to feel swamped.
In the beginning of the pandemic, tracking cases was difficult, Burns said. Most of the reporting data was being done with phone calls and good old-fashioned hand-tracking.
First it was monitoring cases, then it was finding out who was being quarantined and where. Next, it was finding out who the close contacts were for anyone who had COVID.
When OSU announced it was returning to in-person classes this fall, the team at IRA knew things would have to be more organized.
“We had to figure out a way to make sure that faculty advisors and students were all notified when they were positive themselves or when anyone in their class was positive,” said Burns, the associate director of IRA. “And also to find a way for the faculty to tell the university who was sitting by that student, so if that student was positive or when they were notified of a positive student, the faculty would go in and find the students who were sitting around them (front, back, left, right) and what their last date of attendance was.”
IRA collaborated with OSU’s new office devoted to customer relationship management (CRM) to create a system that would alert faculty, staff and students about positive cases and what next steps were.
The CRM office, headed by Dr. David Mariott, started developing a new academic alert system in July that went live before classes started. He received several questions about contact tracing. One was about a way for faculty or staff to monitor positive cases and if the academic alert system could be used for COVID, as well.
“We are very fortunate that it aligned really well with what we are using for the academic alert process,” Mariott said. “Faculty could access and submit those forms very quickly, using the same system that we had already put into place with just a few modifications on our end. We were able to turn that around very quickly. So then faculty were able to submit those and get that information out as quickly as possible, not only to University Health Services but also to email students to let them know about potential exposure in class to help mitigate the spread of COVID.”
IRA and the CRM office was constantly in contact with the Office of the Provost when classes started because of the sheer number of questions that interim provost Jeanette Mendez and interim vice provost Chris Francisco were receiving from faculty concerning contact tracing.
“It has been a lot of work between me, David and then Chris Francisco in the provost’s office,” Burns said. “He gets complaints or suggestions from the faculty and then he calls David and me, and we try to figure out how to make it happen. There are a lot of people in the background in UHS, and all the case managers working on this, too.”
The CRM software that OSU uses is Slate, which is mostly used for student tracking for recruitment and admissions, but once the IRA team found it could be used for COVID tracking, it was a game-changer.
“So we have several systems working together. We have our visual analytics product, which is our COVID-19 dashboard, and that shares information with case managers across campus,” Burns said. “And then we use our CRM to collect data from advisors and from faculty. So this system was bought for another purpose, but we realized quickly that we could use it for tracking COVID if we needed to.
He explained: “We created a whole COVID management system where everyone’s COVID cases are monitored with University Health Services. Faculty members also tell us if someone is positive. We get the self-reporting data. All of that goes into one system that is tracked. Communication is tracked so we can make sure that everyone gets informed.”
Organizing the data into one system has made the difference between the spring and fall semesters like night and day. Last spring, it took days to determine whether someone was exposed or if they are vaccinated and don’t have to quarantine; today, it can be done in 30 minutes.
Previously, students would have to quarantine while UHS was trying to track their information, but now with vaccination data in one system and most professors using seating charts, those students can now continue to go to classes in person.
The number of questions from faculty has gradually declined since the system began.
“Once Provost Mendez made it a priority for us to try to get academic alerts in Slate ready for the fall, it was very easy for us to get folks on board across campus,” Mariott said. “So part of providing that information about the new system included different faculty training workshops and meetings such as Instruction Council prior to classes starting. We also created documentation for advisors and faculty that included step-by-step instructions in both written form and video form. We’ve been very responsive to faculty questions and suggestions since the system went live and that has reduced issues, as well.”
Burns and Mariott have been leading on the organization side of things, but getting the analytics presented in an easy manner for people to understand has fallen on Randy Kitchens.
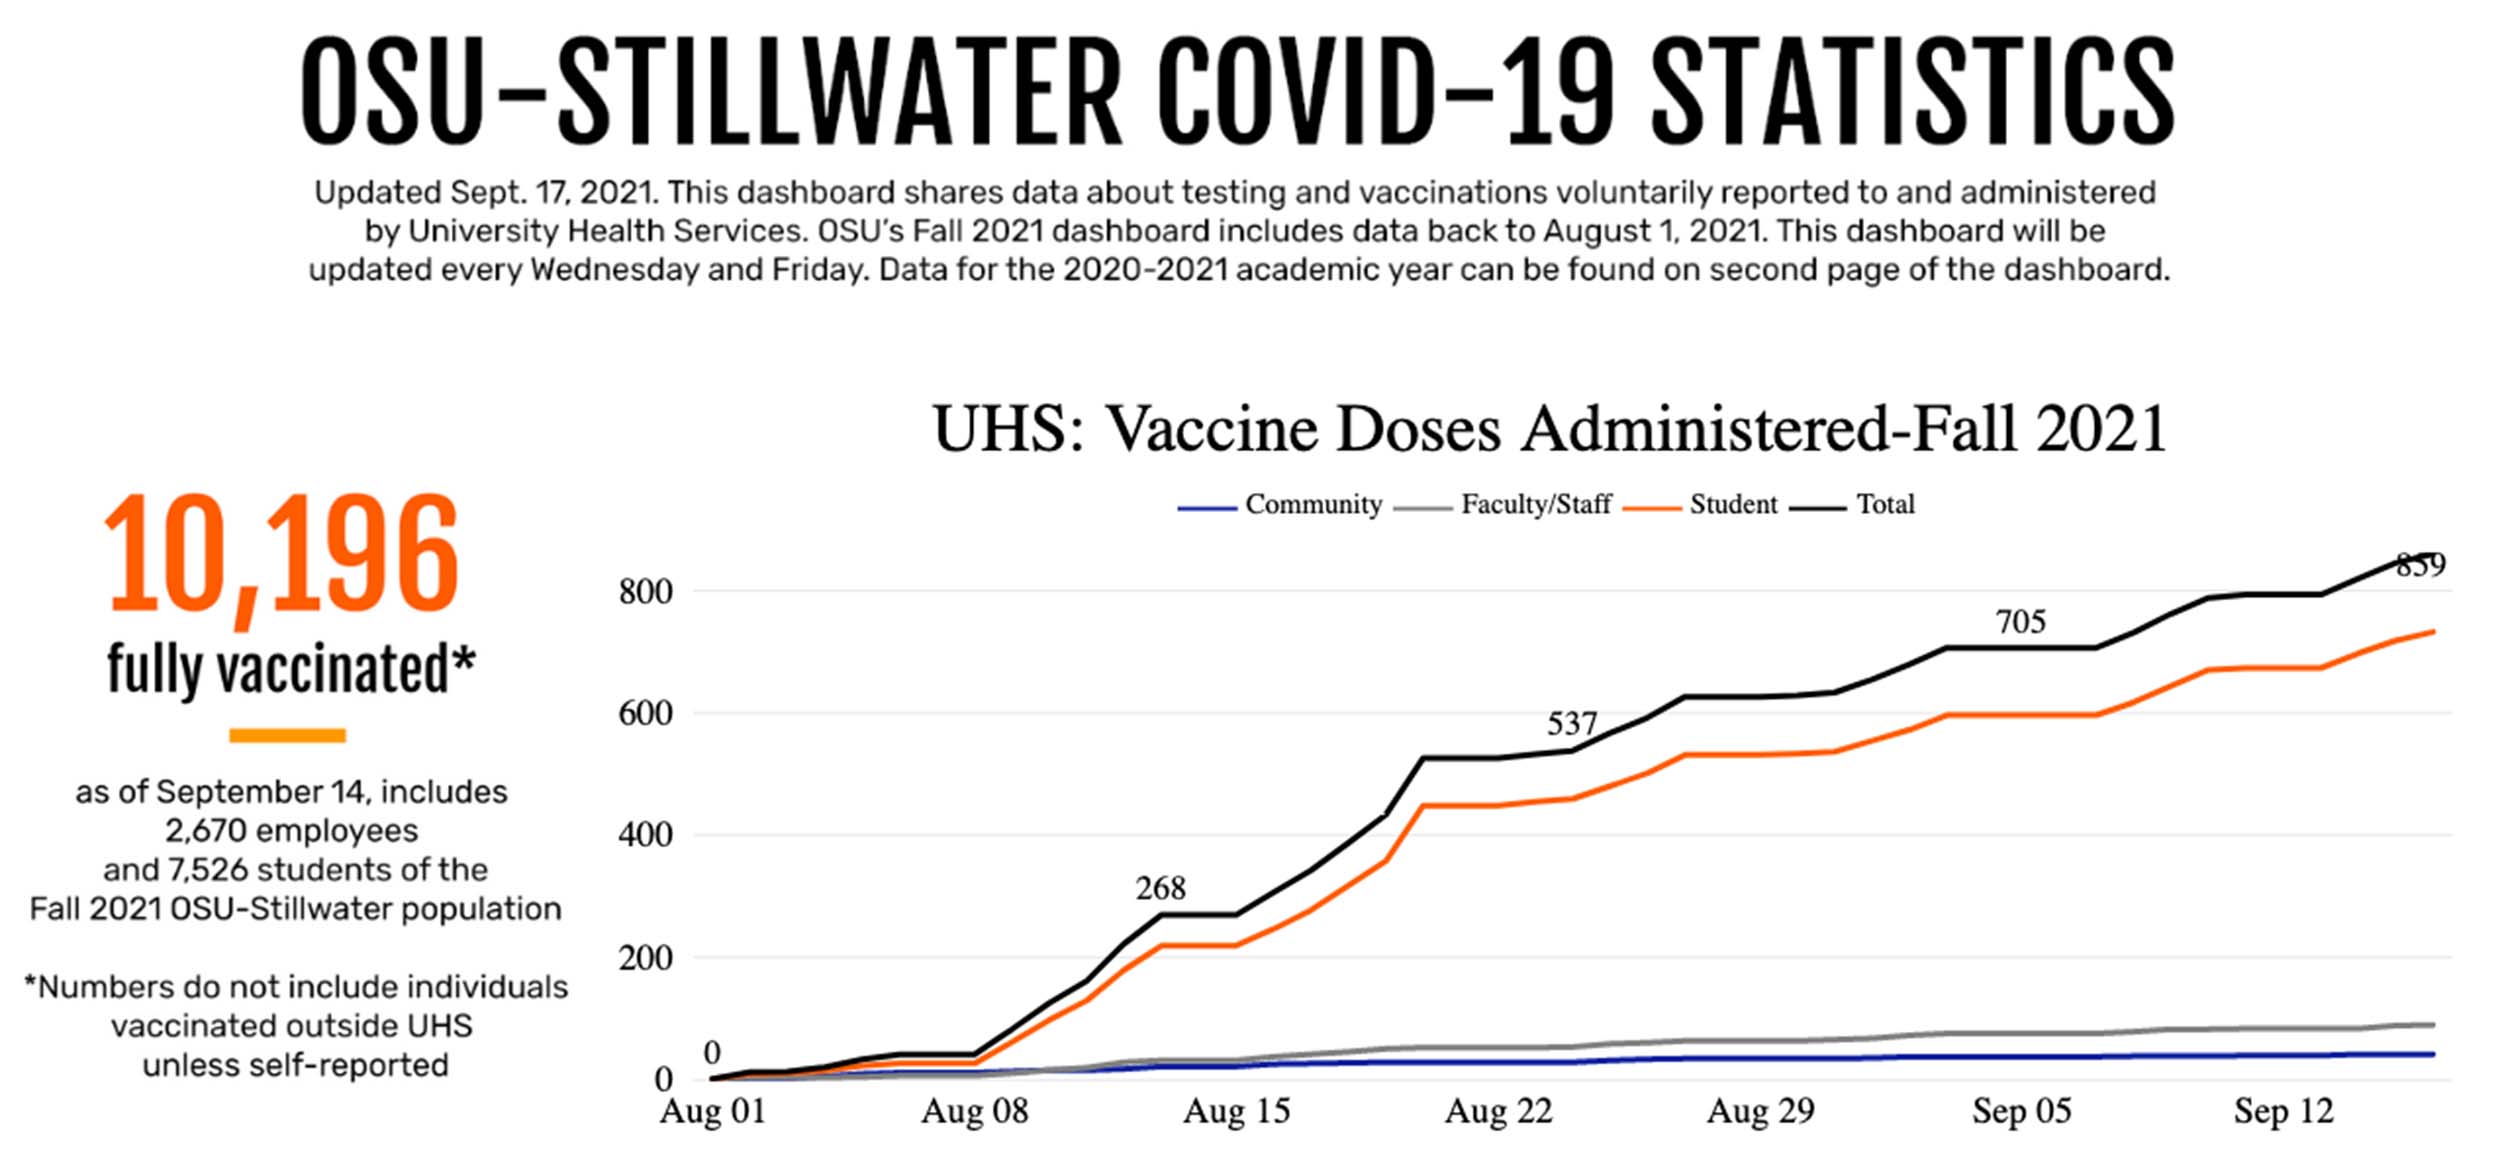
Kitchens, the visual analytics coordinator for IRA, has been in charge of updating the COVID dashboard twice a week for almost two years. It has been a taxing job, but an important one in terms of monitoring how much COVID continues to play a part in our daily lives.
“The data set gets bigger and bigger every time we update,” Kitchens said. “It is up to 7,100 rows of data and the numbers have started to get pretty big again when you look at state and national data.”
Dr. Christie Hawkins, director of IRA, said the work Kitchens has done with the ongoing increase in data has been commendable.
“The COVID dashboard has been an important initiative,” said Hawkins, who is also the associate vice-president for administration and finance. “Randy Kitchens’ ability to develop great visuals that are thorough and easy to understand has provided an invaluable resource for informing both the OSU campus and Stillwater community with up-to-date metrics regarding vaccinations, testing, quarantining and active cases on the OSU campus. Additionally, the ability to pull in state, county and city data has provided an additional layer of highly useful data.”
Along with all of the COVID documentation and graphs that Kitchens and IRA have built on their website, IRA’s data reach has grown exponentially over the past five years.
From enrollment to diversity, finances to grades, IRA has moved from paper documents that were updated once a year to almost 40 reports that are updated constantly, with some updated daily.
“We are putting out so much information and continually updating it to the university,” Kitchens said.
Hawkins said the entire system created by IRA and the new CRM office has assisted OSU in negotiating the pandemic and praised her team's ingenuity to use both SAS and the Slate CRM to help with the project.
“Developing this type of tool has filled a critical need to help OSU manage notifications, quarantining and course adjustments throughout the pandemic,” Hawkins said. “Dr. David Mariott and Larry Burns have worked tirelessly to implement and continually adapt this process as suggestions for improvements were offered from faculty and administration.
“Their ability to think outside the box has expanded the boundaries and resulted in a very unique use of our analytics tools and our new customer relationship management tool for current students.”